


Australian Gambling Statistics: The Key Numbers
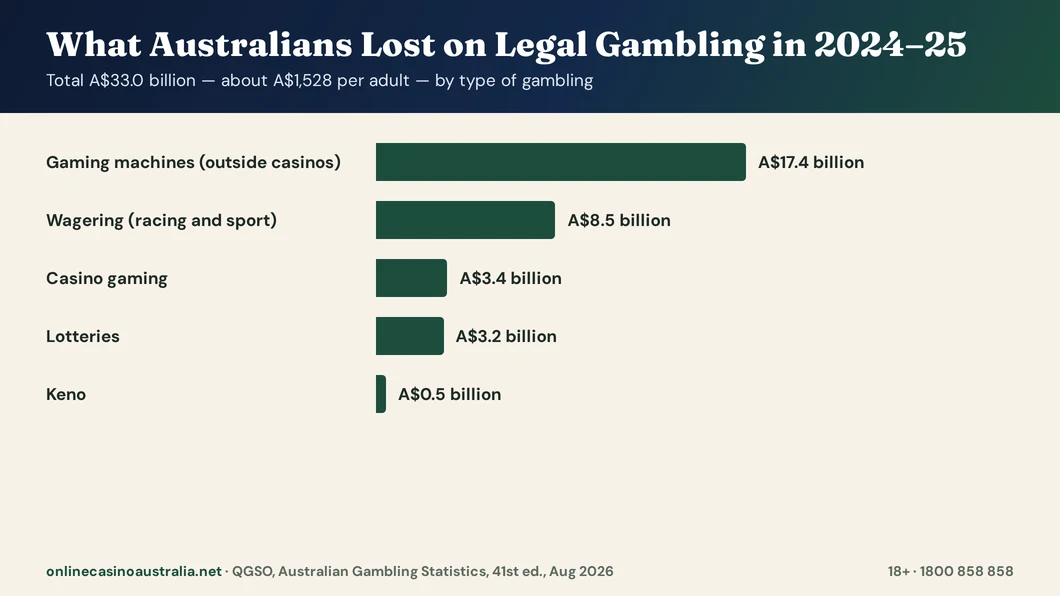
Australians lost A$33.0 billion on legal, regulated gambling in 2024–25 — A$1,527.88 for every adult — and more than half of it, A$17.44 billion, went through poker machines in pubs and clubs (Queensland Government Statistician’s Office, Australian Gambling Statistics, 41st edition, August 2026). In the 12 months to October 2024, 65.1% of adults gambled and 15% — about 3.1 million people — were at some risk of harm (Australian Gambling Research Centre).
This page brings together the latest official figures, each with its source, reference period and publication date. You can download the state table as a CSV file and reuse the numbers with a link to this page. Where surveys use different methods, we keep their figures separate rather than mixing them.
| Measure | Figure | Period | Source |
|---|---|---|---|
| Total losses on legal gambling | A$32,998.975 million | 2024–25 | QGSO, 41st edition |
| Losses per adult | A$1,527.88 | 2024–25 | QGSO |
| Poker machines in pubs and clubs | A$17.44 billion (52.9%) | 2024–25 | QGSO |
| Wagering (racing and sports) | A$8.45 billion (25.6%) | 2024–25 | QGSO |
| Total amount bet (turnover) | A$283.6 billion | 2024–25 | QGSO |
| Gambling revenue to state and territory governments | A$9.86 billion | 2024–25 | QGSO |
| Gaming machines operating | 186,643 | 30 June 2025 | QGSO |
| Adults who gambled in the past year | 65.1% | 12 months to Oct 2024 | AGRC (AIFS) |
| Adults at some risk of harm (PGSI 1+) | 15% | 2024 | AGRC (AIFS) |
| BetStop registrations | 71,391 (43,090 active) | to 30 Sep 2026 | ACMA |
| Illegal gambling and affiliate sites blocked | 1,822 | Nov 2019 – 24 Sep 2026 | ACMA |
What Australians Lose, by Type of Gambling
| Type | Losses 2024–25 | Share | Real change over 10 years |
|---|---|---|---|
| Poker machines (clubs and hotels) | A$17.44 billion | 52.9% | +14.7% |
| Wagering (racing and sports) | A$8.45 billion | 25.6% | +69.4% |
| Casinos (table games and casino machines) | A$3.37 billion | 10.2% | −50.4% |
| Lotteries, lotto and instant scratchies | A$3.19 billion | 9.7% | +22.1% |
| Keno | A$482.8 million | 1.5% | +12.6% |
“Losses” here means expenditure: the amount bet minus the amount won. Real changes compare 2014–15 with 2024–25 in 2024–25 dollars. Wagering grew fastest — up 69.4% in real terms in a decade — while casino losses halved. Source: QGSO summary tables and state tables.
Losses by State and Territory
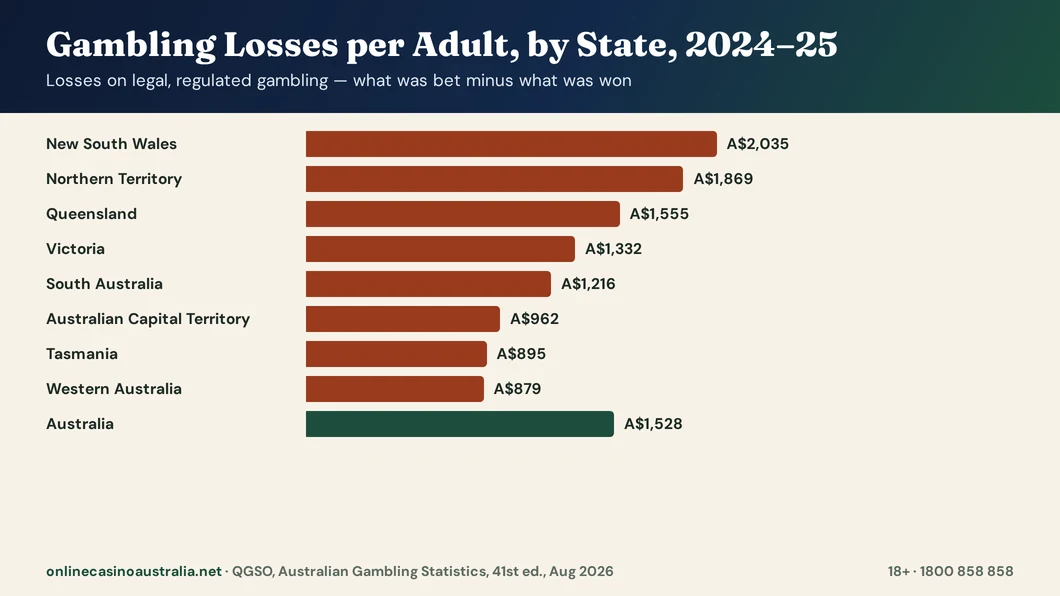
| State or territory | Total losses | Per adult | Share of national | Pokies per adult (clubs and hotels) | Gaming machines (30 June 2025) |
|---|---|---|---|---|---|
| New South Wales | A$13.71 billion | A$2,035.09 | 41.6% | A$1,344.39 | 89,430 |
| Victoria | A$7.38 billion | A$1,331.65 | 22.4% | A$567.26 | 28,886 |
| Queensland | A$6.84 billion | A$1,554.71 | 20.7% | A$857.10 | 44,221 |
| South Australia | A$1.84 billion | A$1,215.79 | 5.6% | A$666.22 | 12,815 |
| Western Australia | A$2.07 billion | A$879.09 | 6.3% | No pokies outside the casino | 2,033 |
| Tasmania | A$414 million | A$895.23 | 1.3% | A$243.30 | 3,262 |
| Australian Capital Territory | A$367 million | A$961.91 | 1.1% | A$499.04 | 3,401 |
| Northern Territory | A$373 million | A$1,869.07 | 1.1% | A$797.64 | 2,595 |
| Australia | A$33.00 billion | A$1,527.88 | 100% | A$807.67 | 186,643 |
New South Wales accounts for 41.6% of national losses and A$2,035.09 per adult, the highest in the country; it also has 89,430 gaming machines, 47.9% of the national total. Western Australia, which has no poker machines outside its casino, has the lowest losses per adult at A$879.09. The Northern Territory’s figures from 2019–20 onwards count only NT residents’ wagering, so we do not compare its ten-year trend.
How Losses Have Changed
| Measure | 2014–15 (in 2024–25 dollars) | 2024–25 | Change |
|---|---|---|---|
| Total losses | A$30.07 billion | A$33.00 billion | +9.7% |
| Losses per adult | A$1,641.76 | A$1,527.88 | −6.9% |
| Share of household disposable income | 2.09% | 1.92% | down |
Total losses grew in real terms over the decade, but more slowly than the adult population, so losses per adult fell 6.9%. The real peak of the series was A$33.57 billion in 2022–23. Gambling took 3.18% of household disposable income in 1999–00, 2.09% in 2014–15 and 1.92% in 2024–25 (QGSO).
Who Gambles
The Australian Gambling Research Centre’s National Gambling Prevalence Study pilot, published in September 2025, surveyed 3,881 adults about the 12 months to October 2024.
| Measure | Figure |
|---|---|
| Adults who gambled at least once | 65.1% (56.9% in 2019) |
| Adults who gambled at least monthly | 31.9% (men 35.9%, women 28.3%) |
| Lotteries | 52.7% |
| Instant scratch tickets | 24.5% |
| Poker machines | 19.8% |
| Race betting | 17.8% |
| Sports betting | 12.5% |
| Keno | 10.2% |
| Casino table games | 7.9% |
Participation was highest in Queensland (70.2%) and lowest in Tasmania (59.9%) and Victoria (60.0%) (AGRC, National Gambling Prevalence Study Pilot 2024).
Gambling Harm
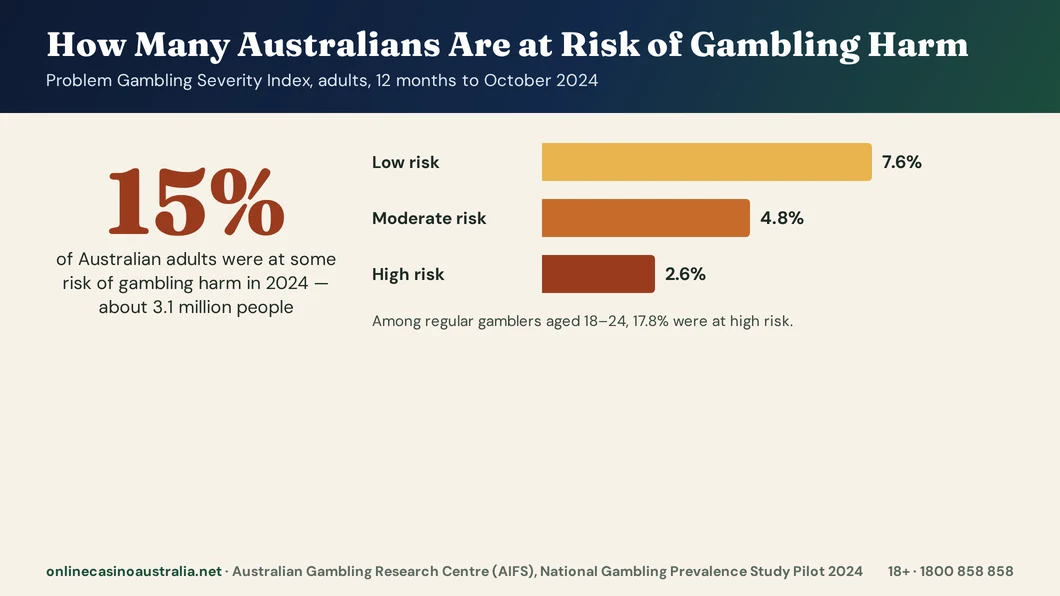
On the Problem Gambling Severity Index, 15% of Australian adults were at some risk of gambling harm in 2024: 7.6% at low risk, 4.8% at moderate risk and 2.6% at high risk. The Australian Institute of Family Studies estimates this as about 3.1 million adults.
| Group | Finding | Source |
|---|---|---|
| Young adults | 17.8% of regular gamblers aged 18–24 were at high risk, against 10.4% of those aged 35–44 | AGRC 2024 |
| Aboriginal and Torres Strait Islander adults | 27.1% at some risk, against 14.6% of other Australians | AGRC 2024 |
| High-risk gamblers | 65.9% experienced financial hardship such as going without meals; 15.5% reported suicidal ideation | AGRC 2024 |
| Partners | 18.9% of people whose partner gambled weekly or more experienced intimate partner violence, against 6.8% | AGRC 2024 |
| Long-run trend | High-risk gambling rose from 1.1% of Australians in 2018 to 1.8% in 2022 | HILDA Survey, via AIHW |
| Pokie spending | Typical monthly spending by pokie players rose from A$120.66 in 2015 to A$241.09 in 2022, in real terms | HILDA Survey, via AIHW |
These surveys use different methods and populations, so their figures should not be compared directly — the AIHW makes the same point (AIHW, Gambling).
Online Gambling
In the six months to June 2025, 38% of Australian adults gambled online. Among them, 80% played lotteries, 18% bet on racing and 17% on sports — and 10.4% said they had played pokies or slots online (ACMA, How we use the internet, February 2026). Online pokies cannot legally be offered to people in Australia; the survey does not say whether they were played on illegal sites or elsewhere.
The ACMA has had 1,822 illegal gambling and affiliate websites blocked since November 2019, and more than 230 illegal services have left the Australian market since it began enforcing the rules in 2017 (ACMA, 24 September 2026). In April to June 2026 alone it handled 465 enquiries and complaints and found 56 breaches of the Interactive Gambling Act (ACMA). Estimates of offshore spending exist only from private sources, such as H2 Gambling Capital figures cited by the ACMA, and are not official statistics.
Self-Exclusion: BetStop
| Measure | Figure |
|---|---|
| Registrations since launch (21 August 2023) | 71,391 |
| Active exclusions at 30 September 2026 | 43,090 |
| Registrants aged 30 or younger | 46.7% |
| Registrants who chose a lifetime exclusion | 38% (27,241) |
| Most registrations | NSW 22,344 · Victoria 18,936 · Queensland 14,799 |
BetStop covers Australian-licensed online and phone wagering only — not offshore casinos (ACMA, October 2026).
Government Revenue and Gaming Machines
State and territory governments collected A$9.86 billion in gambling revenue in 2024–25, A$5.80 billion of it from poker machines. There were 186,643 gaming machines at 30 June 2025 — 104,455 in clubs, 69,046 in hotels and 13,142 in casinos — down from 196,661 ten years earlier (QGSO).
Using These Figures
- Quote each figure with its source and period — for example, “A$33.0 billion in 2024–25 (QGSO, 41st edition)”.
- Do not add or compare figures from different surveys; their methods differ.
- The QGSO calls its per-adult figure “per capita”, but it divides by adults aged 18 and over.
- For Western Australia’s participation rate, the AGRC report gives 69.6% in the text and 69.9% in a chart; we use the text figure.
- The state table is available as a CSV file for reuse with attribution.
Where to Get Help
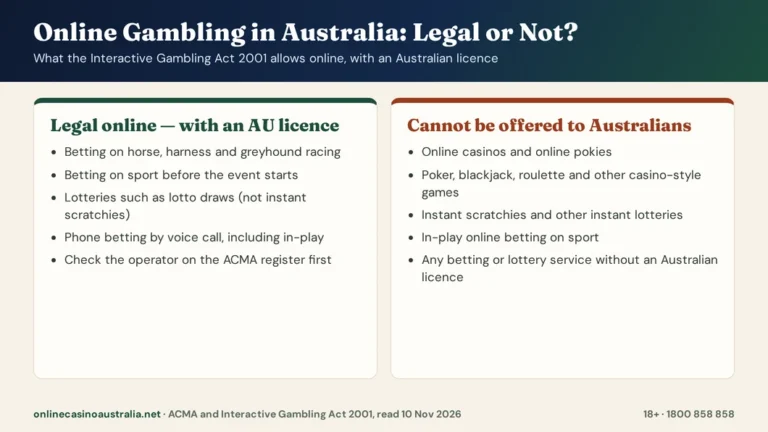
Free, confidential support is available 24 hours a day on the National Gambling Helpline, 1800 858 858, and at Gambling Help Online. Our responsible gambling guide covers limits, blocking tools and self-exclusion, and our guide to Australian gambling law explains what is legal online.
Sources and Methodology
Every figure comes from a primary source read on 10 November 2026: the Queensland Government Statistician’s Office, Australian Gambling Statistics, 41st edition (published 11 August 2026); the Australian Gambling Research Centre’s National Gambling Prevalence Study Pilot 2024 (published 24 September 2025); the AIHW’s report on gambling (HILDA Survey figures); the ACMA’s BetStop statistics (October 2026), blocking announcement (24 September 2026), quarterly action report (August 2026) and internet use survey (February 2026); and the House of Representatives Standing Committee report of June 2023. Real-terms changes and percentage shares are calculated by us from the QGSO tables. Compiled by Michael Jones — see our editorial policy. 18+ only.
- QGSO — Australian Gambling Statistics, 41st edition, summary tables
- QGSO — state tables (Excel)
- AGRC — National Gambling Prevalence Study Pilot 2024
- AIHW — Gambling
- ACMA — BetStop statistics, Q1 2026–27
- ACMA — illegal gambling websites blocked, 24 September 2026
- ACMA — action on interactive gambling, April–June 2026
- ACMA — How we use the internet, February 2026